Roman Galactic Center Science Program

Measuring the motions of millions of stars around the Milky Way's supermassive black hole, to learn how the heart of a galaxy is built.

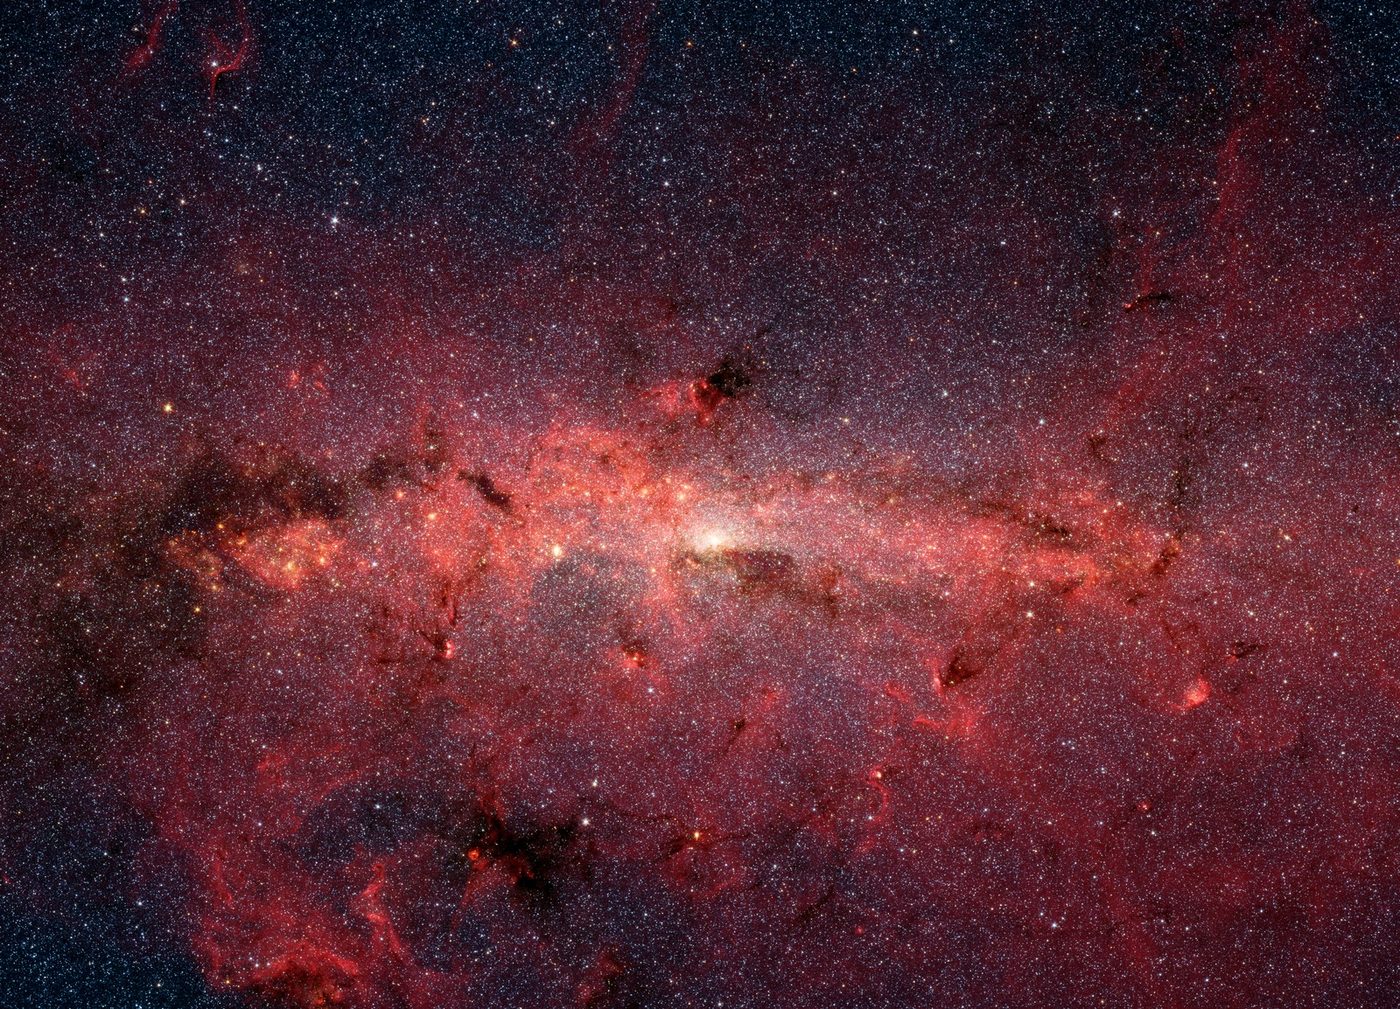
Galactic center in X-ray, infrared and near-infrared: NASA / ESA / CXC / SSC / STScI
~7million
stars with precise motions after three survey seasons
0.4mas/yr
proper-motion precision — about 15 km/s at the Galactic Center
~800arcmin²
contiguous field, from Sgr A* out through the Arches and Quintuplet clusters
100×
more stars than any previous proper-motion survey of the region
12min
between images during each ~70-day high-cadence season

Expected performance for the Galactic center field of Roman's Galactic Bulge Time Domain Survey, based on the survey design and Roman's Wide Field Instrument exposure-time calculator. Results will be updated as data arrive.

Why the Galactic center?

The only galactic nucleus where we can watch the stars move

The center of our Galaxy is 26,000 light-years away — close enough that telescopes can pick out individual stars and follow them from year to year. Nowhere else in the universe can we do that inside a galactic nucleus.

At the very center sits Sagittarius A*, a black hole of four million solar masses. Around it is the nuclear star cluster, the densest collection of stars in the Milky Way, and around that a flattened, rapidly rotating disk of stars several hundred light-years across. The region is also making new stars: it holds three of the most massive young star clusters in the Galaxy, all younger than about five million years.

Structures like these appear in the nuclei of most spiral galaxies, and the growth of nuclear star clusters seems to be tied to the growth of central black holes and of the galaxies themselves. But in other galaxies they are unresolved blurs of light. The Galactic center is our one chance to take a nucleus apart star by star and ask how it was assembled.

  • Sgr A*~4×10⁶ M⊙
    The supermassive black hole. The stars closest to it complete an orbit in as little as a decade or two.
  • Nuclear star cluster~107 M⊙ · r ~ 5 pc
    Millions of mostly old stars packed within about 15 light-years of the black hole. Its half-light radius is roughly 4 pc.
  • Nuclear stellar disk~109 M⊙ · r ~ 200 pc
    A rotating disk of stars, about 50 pc thick, that surrounds the cluster and likely records a long history of gas flowing inward.
  • Young clusters~104 M⊙ each · <5 Myr
    The Arches, Quintuplet and Young Nuclear clusters, plus roughly 80 young massive stars found on their own, scattered across the region.
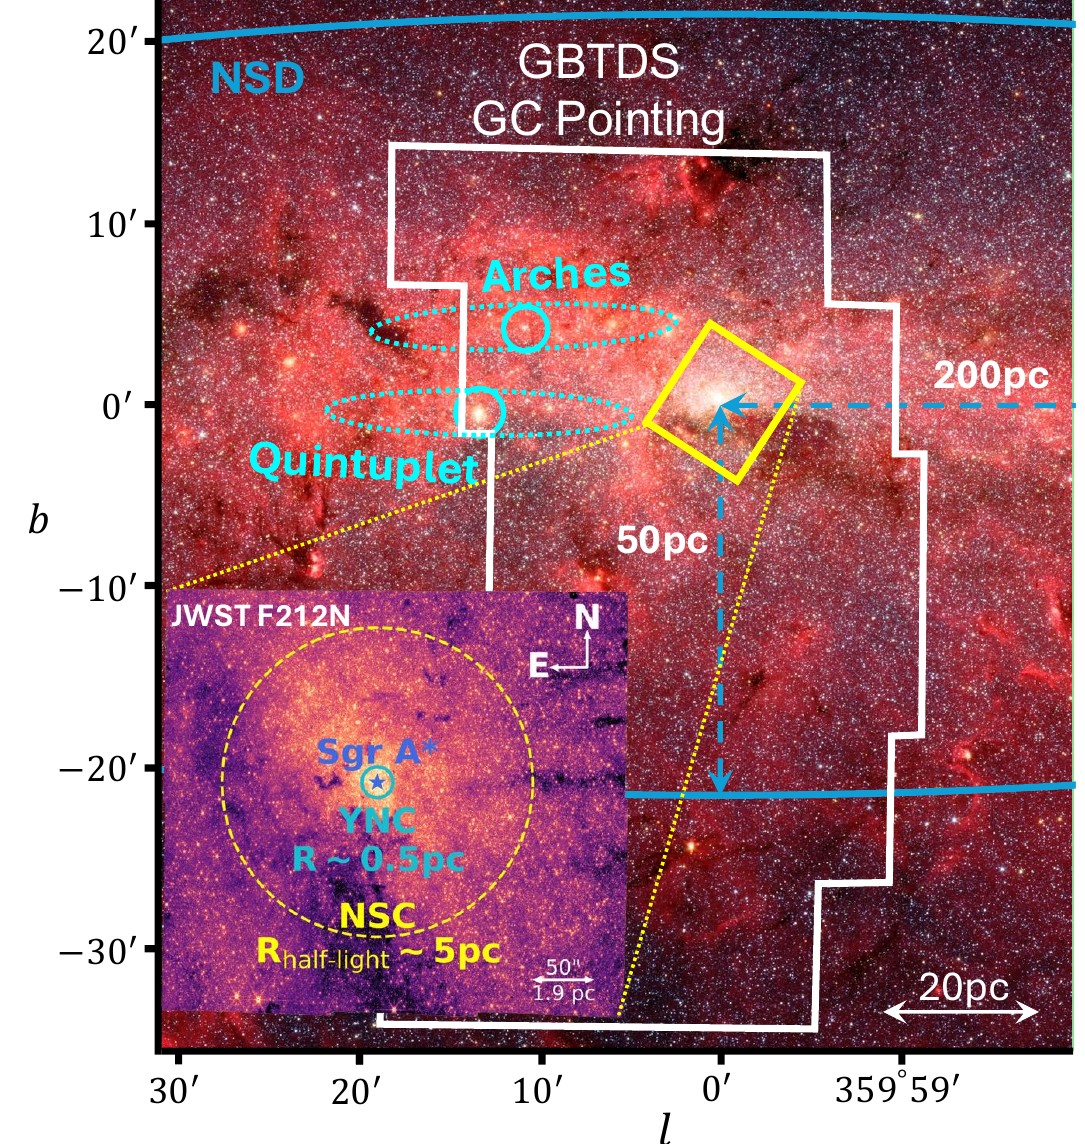
Infrared image of the Galactic Center with the Roman GBTDS Galactic Center pointing outlined in white, the Arches and Quintuplet clusters marked, the nuclear stellar disk extent indicated, and a JWST inset of the nuclear star cluster around Sgr A*.
The Roman survey field (white outline) laid over the central ~100 pc of the Milky Way. The cyan ellipses mark the Arches and Quintuplet clusters; the inset shows the nuclear star cluster around Sgr A* as seen by JWST at 2.12 µm. Background: Spitzer/IRAC, NASA/JPL-Caltech.
Spitzer Space Telescope infrared mosaic of the Galactic Center region showing dense star fields and glowing dust clouds.
The central few hundred light-years of the Galaxy in the infrared. Visible light cannot penetrate the dust in this direction; Roman observes at the infrared wavelengths that can. NASA/JPL-Caltech/S. Stolovy (SSC/Caltech).
Roman & the survey

A telescope with a hundred times the view of Hubble, pointed at the center of our Galaxy for 70 days at a stretch

The Nancy Grace Roman Space Telescope's Wide Field Instrument images a patch of sky about 100 times larger than Hubble's infrared camera in a single exposure, with comparable sharpness. Its Galactic Bulge Time Domain Survey (GBTDS) will stare at six fields near the Galactic center every 12 minutes for ten seasons of roughly 70 days each, primarily to hunt for planets by microlensing.

One of those six fields is centered on the Galactic center itself, covering Sgr A*, the nuclear star cluster and the Arches and Quintuplet clusters in one contiguous footprint. The result is a movie of the Galactic nucleus: tens of thousands of frames of the same seven million stars, spread over years.

Stack those frames and tiny shifts in each star's position become measurable. Stars at the Galactic center drift across the sky by a few thousandths of an arcsecond per year. Roman should measure those drifts to 0.4 milliarcseconds per year for every star brighter than about 24th magnitude. This is the angle a human hair subtends at a distance of about 35 kilometers. That level of precision has so far been reached only in small Hubble fields covering a few percent of the region.

What makes this possible is proper motions of Hubble quality over the entire nucleus.

For researchers: survey parameters
SurveyGalactic Bulge Time Domain Survey (GBTDS), a Roman Core Community Survey
Fields6 WFI pointings, 1.7 deg² total: 5 contiguous fields near (l, b) ≈ (0.5°, −1.4°) plus 1 field on the Galactic center
Primary filterF146 (0.93–2.00 µm wide band), 12.1-min cadence
Color / snapshot filtersF087, F213 every ~6 hr; F062, F106, F129, F158, F184 and prism/grism snapshots
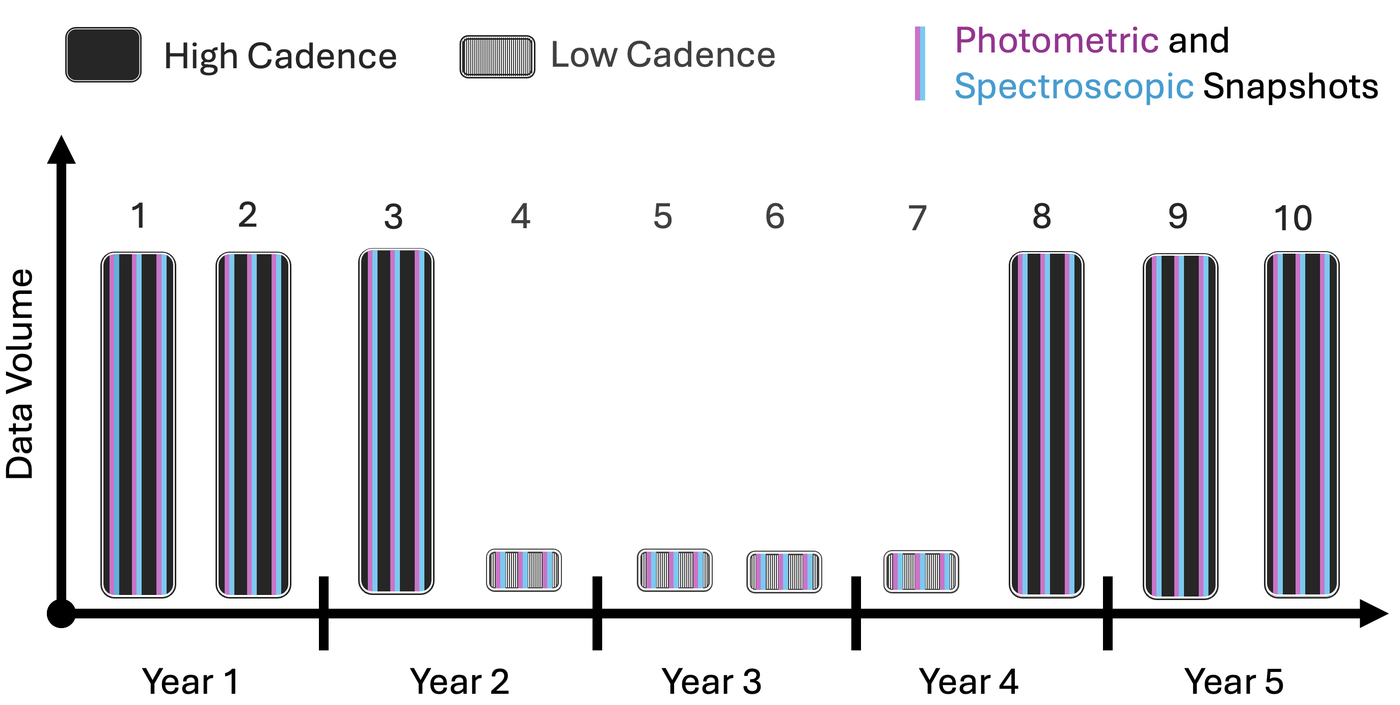
Seasons6 high-cadence (~70.5 d each) and 4 low-cadence (~72 d, 5-day cycle) seasons over the 5-year prime mission; 438 observing days in total
Expected astrometryσμ ≤ 0.4 mas/yr to F146 ≈ 23.7 (Vega) after the first three high-cadence seasons; ~7×10⁶ stars over ~800 arcmin²
Physical scaleAt 8 kpc, 1 mas/yr ≈ 38 km/s; 0.4 mas/yr ≈ 15 km/s. 1′ ≈ 2.3 pc
Data rightsAll Roman data are public immediately, with no proprietary period
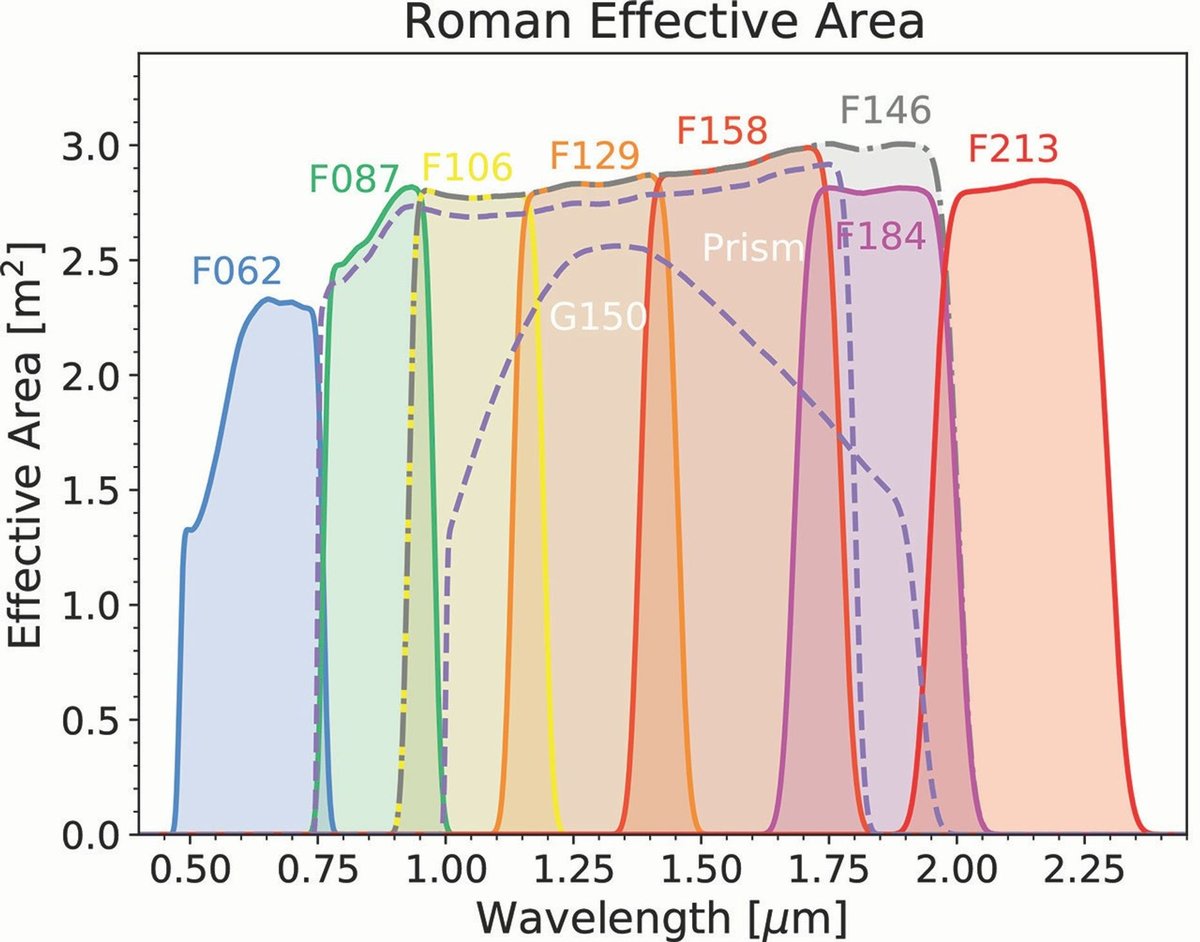
Plot of Roman effective area versus wavelength for filters F062 through F213, the wide F146 filter, the grism and the prism.
Roman's filter set. The survey's workhorse F146 band spans 0.93–2.0 µm, collecting light through the dust that hides the Galactic center at visible wavelengths. Roman Space Telescope / STScI.

Survey definition: GBTDS on Roman User Documentation and the Definition Committee report (Jan 2025). Scientific case for the Galactic center field: Terry, Hosek, Lu et al. (2023).

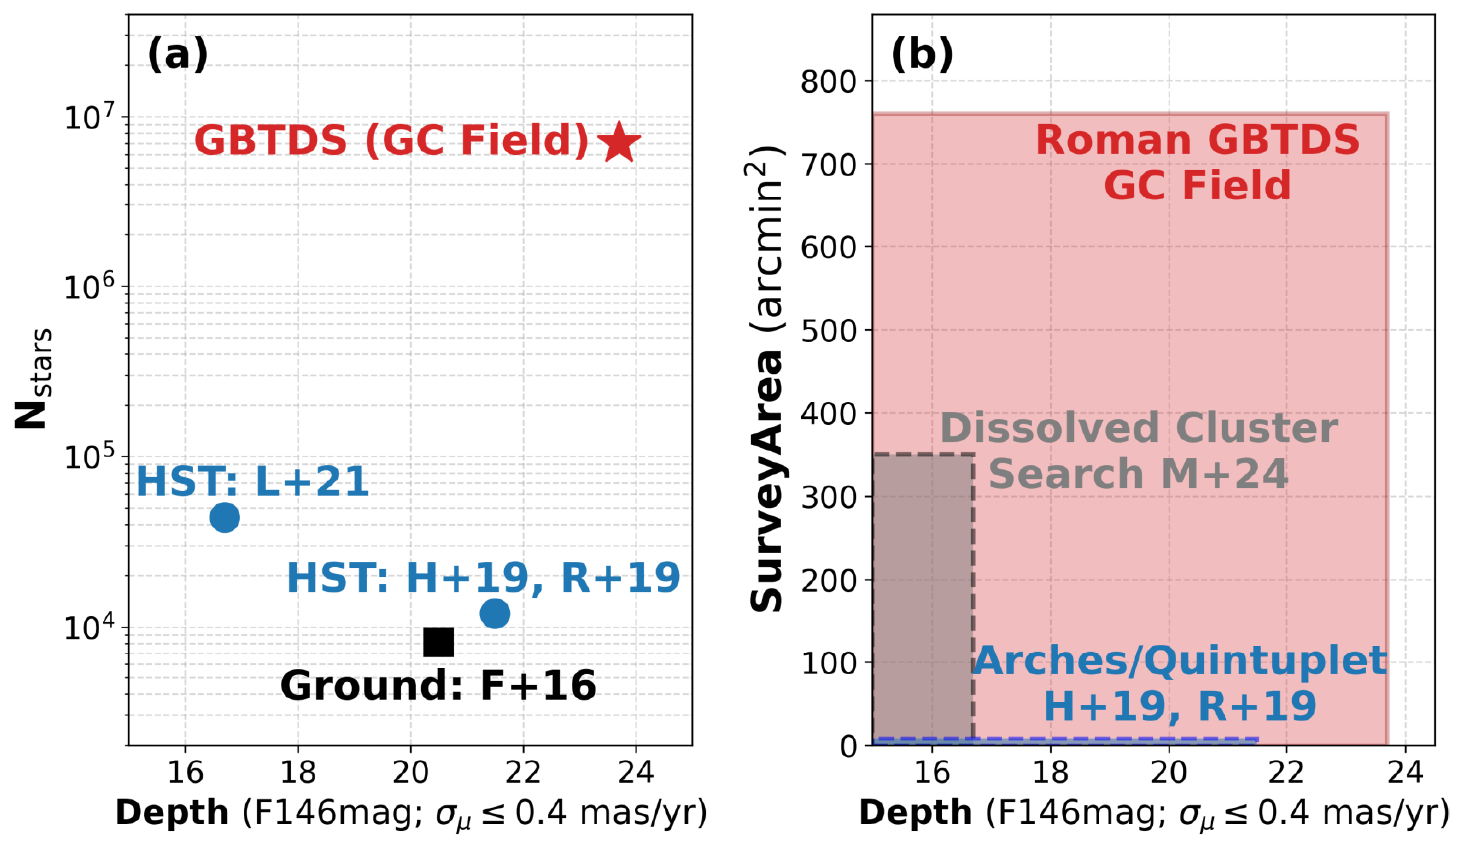
Two panels comparing proper-motion surveys of the Galactic Center by depth: the Roman GBTDS Galactic Center field reaches about 7 million stars over roughly 800 square arcminutes, versus tens of thousands of stars in small HST fields and a ground-based survey.
How the Roman field compares with existing proper-motion surveys of the region, in number of stars (a) and area (b) reaching 0.4 mas/yr precision. Ground: Fritz et al. 2016; HST: Hosek et al. 2019, Rui et al. 2019, Libralato et al. 2021; dissolved-cluster search: Martínez-Arranz et al. 2024.
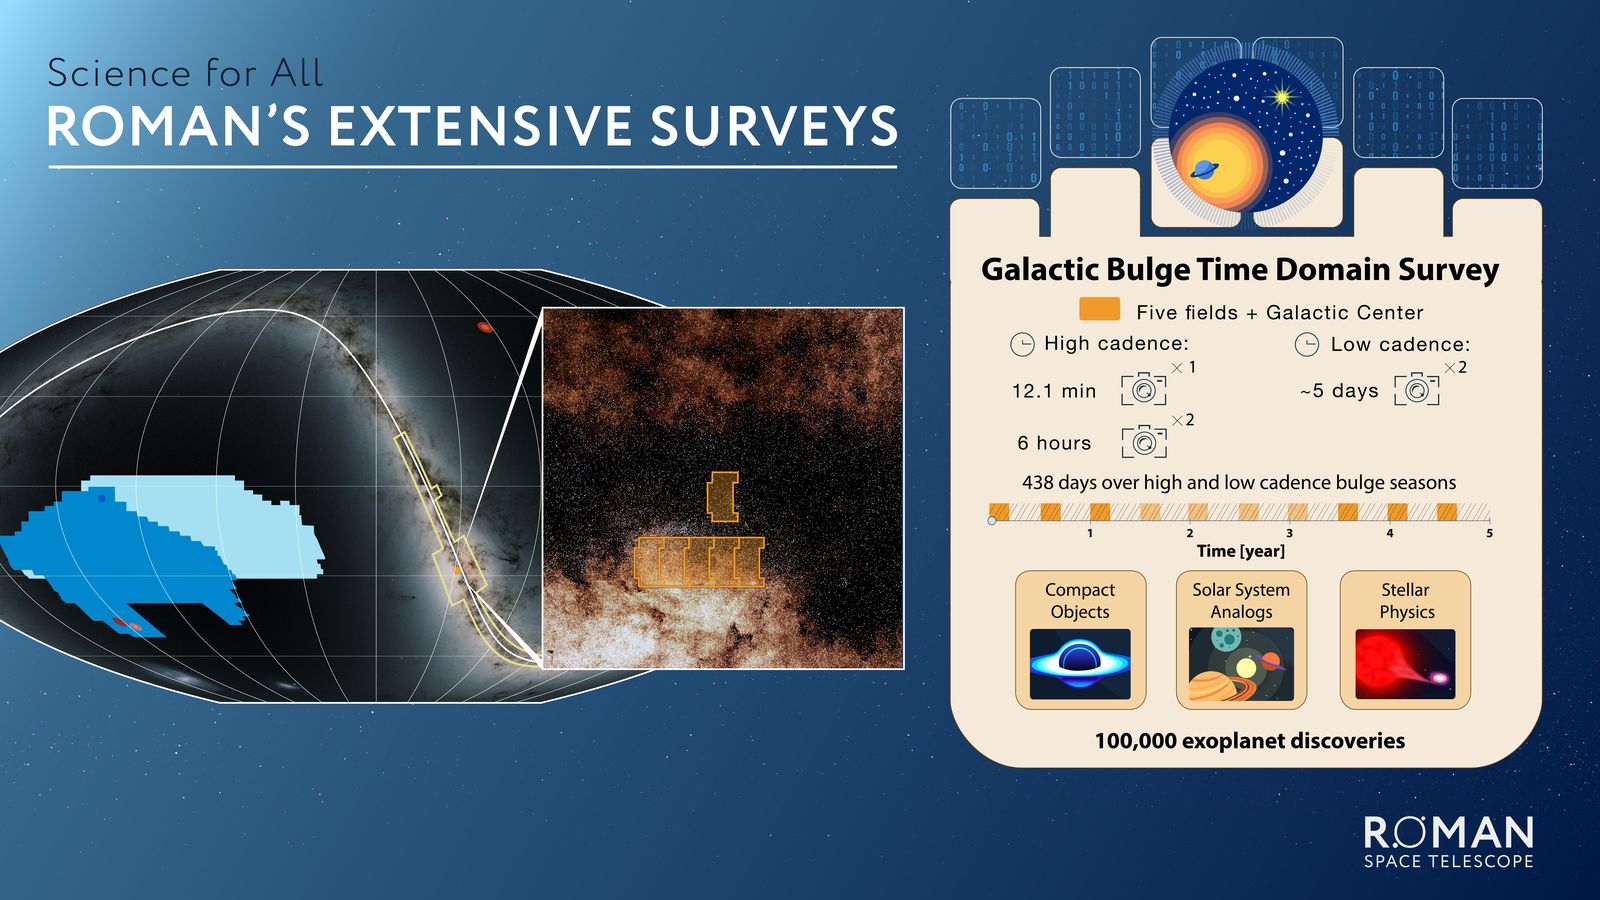
NASA infographic of Roman's Galactic Bulge Time Domain Survey: five fields plus the Galactic Center, 12.1-minute high cadence, 438 days over five years, with science themes of compact objects, solar system analogs and stellar physics.
Roman's Galactic Bulge Time Domain Survey: five fields plus the Galactic Center, imaged every 12.1 minutes during high-cadence seasons, for 438 days over the five-year mission. NASA / Roman Space Telescope.
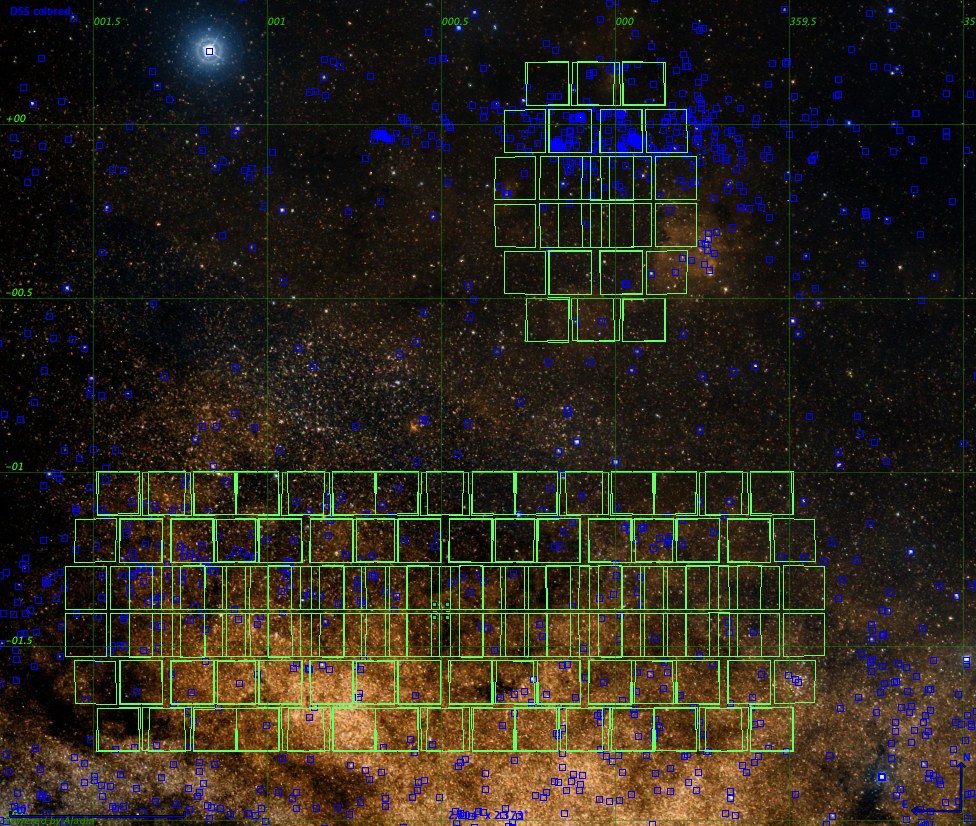
Optical sky image with the six Roman GBTDS field outlines drawn in green; the isolated field at top is the Galactic Center pointing, the group of five fields lies below it.
The six survey fields drawn on a visible-light image of the sky. The isolated field at top is the Galactic Center pointing; the five microlensing fields are about 1.4° south. Aladin Sky Atlas view.
Schematic of the ten GBTDS seasons across the five-year mission: high-cadence seasons 1, 2, 3, 8, 9 and 10 and low-cadence seasons 4 through 7.
The ten GBTDS seasons. The first three high-cadence seasons already deliver the astrometric precision this program needs; later seasons extend the time baseline.
Science questions

Four big questions about the center of Galaxy

Each question is described first for a general reader. Open the For researchers panels for the measurements, methods and literature behind it.

Q1

How did the center of our Galaxy form?

The nuclear star cluster is embedded inside the nuclear stellar disk, yet we do not know whether they formed the same way. One idea is that massive star clusters born farther out spiraled into the center and merged. Another is that gas streamed inward and formed stars in place. Most likely both happened, in some sequence we have not yet worked out.

The two histories leave different fingerprints in how stars move. Stars from swallowed clusters keep a memory of their arrival in the form of streams and odd rotation patterns that can persist for up to a billion years. Stars born from inflowing gas share the ordered rotation of the disk they came from. Existing observations reach either the innermost few parsecs or scattered patches farther out. The transition between cluster and disk, where the answer lives, has never been mapped in detail.

Roman will measure the motions of millions of stars continuously from the black hole out through the disk, giving us a complete picture of the region in a level of detail never before seen.

For researchers: NSC/NSD dynamical modeling

Proposed formation pathways for the NSC include cluster inspiral driven by dynamical friction (Antonini et al. 2012; Tsatsi et al. 2017), in-situ star formation fueled by episodic gas inflow (Alexander & Pfuhl 2014), and hybrid scenarios in which early inspirals are followed by continued gas accretion (van Donkelaar et al. 2024). The NSD is thought to arise from sustained star formation in the central molecular zone (Schultheis et al. 2021; Schödel et al. 2023). Distinct pathways should leave distinct kinematic signatures, including long-lived streams from infalling clusters (Arca Sedda et al. 2020).

Existing kinematic data are limited to the inner ~30 pc for proper motions plus sparse radial velocities (Feldmeier-Krause et al. 2025), and NSD models have relied on heavily extrapolated coverage (Sormani et al. 2022). Spectroscopy of the inner parsecs already shows the NSC is chemically inhomogeneous, with a metal-poor population that appears to rotate differently from the dominant metal-rich stars (Do et al. 2020), a possible infalling-cluster remnant.

The program will fit self-consistent phase-space (distribution-function) models of the NSC, NSD and inner bar simultaneously, using red clump stars as tracers, to recover the 3D density, mass distribution and rotation, and to measure the gravitational potential in the inner 25–50 pc — currently the dominant systematic in dynamical studies of the region. Roman's expected 0.4 mas/yr precision resolves the ~50 km/s NSD velocity dispersion at high significance, with ~100× more stars and ~50× more area than previous NSD modeling.
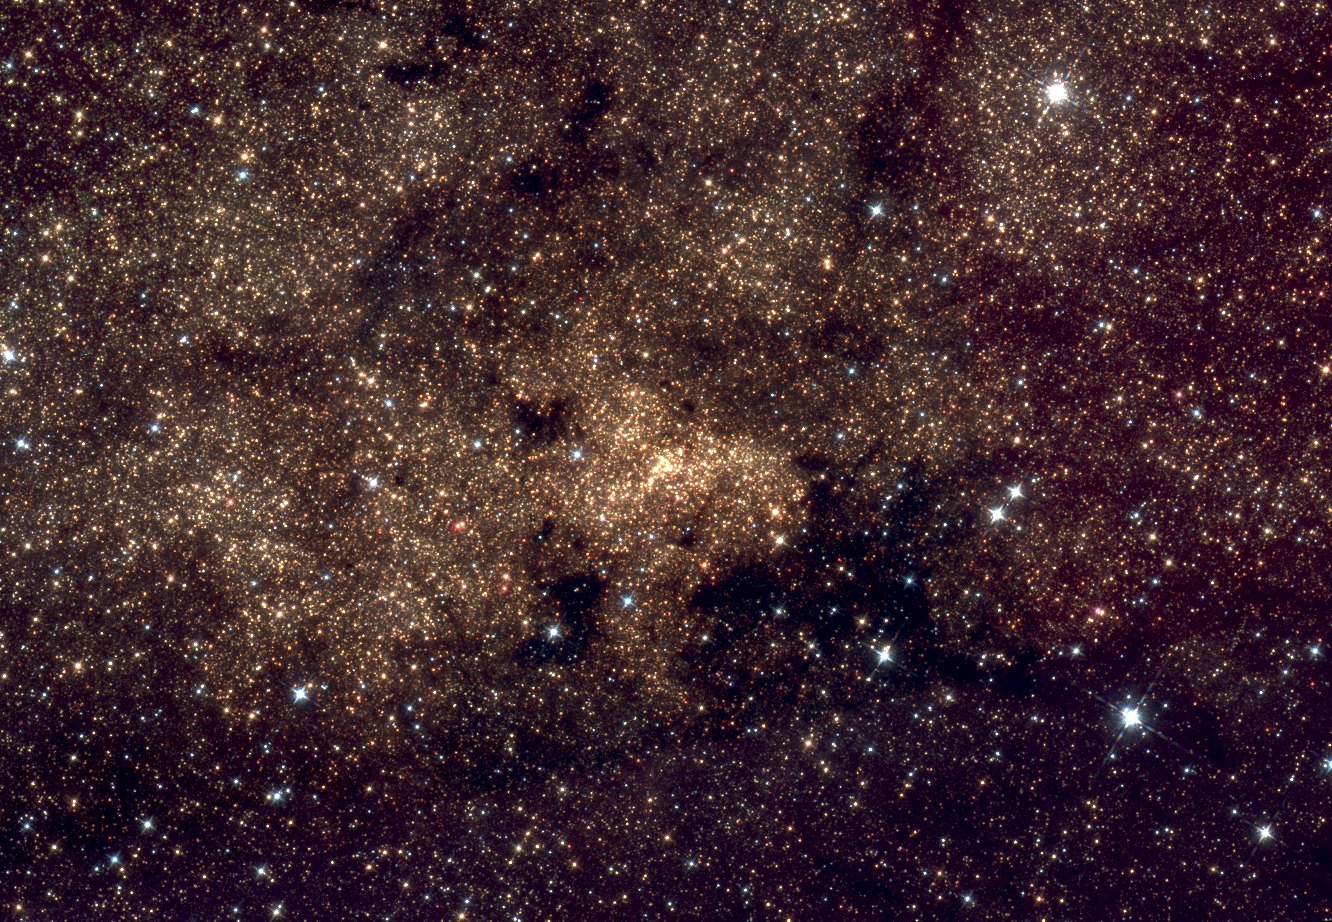
Hubble Space Telescope near-infrared image of the nuclear star cluster, a dense concentration of stars around Sgr A* with dark dust lanes crossing the field.
The nuclear star cluster in the near-infrared with the Hubble Space Telescope (WFC3-IR; F127M, F139M, F153M). Its half-light radius is about 4 pc, or roughly 2′ on the sky. Credit: M. Hosek, T. Do et al. (UCLA) / NASA / ESA.
Q2

How do star clusters live and die in the tidal grip of a galactic center?

The Arches and Quintuplet clusters are among the most massive young star clusters in the Milky Way, and they orbit only about 100 light-years from the black hole. Gravity there is so lopsided that the clusters are being pulled apart. Models say they should dissolve entirely within about 20 million years, and that by now they should trail long tails of escaping stars, tens of light-years long.

Those tails have never been seen. The escaping stars look exactly like the millions of unrelated stars around them; the only way to tell them apart is that they still move with the cluster. Previous surveys either did not cover the region where the tails should be or could not measure faint stars well enough to find them.

Finding the tails would give us the first direct look at a star cluster being dismantled by a galactic nucleus. It also matters for a puzzle called the missing-clusters problem: the Galactic center forms stars fast enough that it should hold many more young clusters than we see. Tidal destruction is the leading explanation, and the tails would give us our biggest clue.

For researchers: tidal tails and the cluster IMF

Dynamical models predict the Arches and Quintuplet (projected distances ~30 pc from Sgr A*) dissolve within ~20 Myr under the local tidal field (Kim et al. 2000; Portegies Zwart et al. 2002) and should already exhibit tails extending >10 pc, dominated by stars below ~2 M⊙ (Habibi et al. 2014; Park, Goodwin & Kim 2018). Existing proper-motion studies reach only the bound population within r < 3 pc (Hosek et al. 2019; Rui et al. 2019) or lack the precision to isolate low-mass members.

The GBTDS field covers >10 pc along the clusters' projected orbits, whose bulk motions are known to high precision (Hosek et al. 2022), and reaches σμ ≤ 0.4 mas/yr down to ~0.5 M⊙ for a young Arches-like population. Tail members will be identified as overdensities in proper motion, position and color space using mixture-model techniques already validated on the bound clusters, then characterized through their density profiles and mass functions.

The stripped population is also the largest uncertainty in the clusters' initial mass functions. The Arches IMF is measured to be top-heavy relative to the local IMF for M ≥ 2 M⊙ (Hosek et al. 2019), but existing analyses neglect stars lost to the tails, which matters most at the low masses now becoming accessible with JWST.

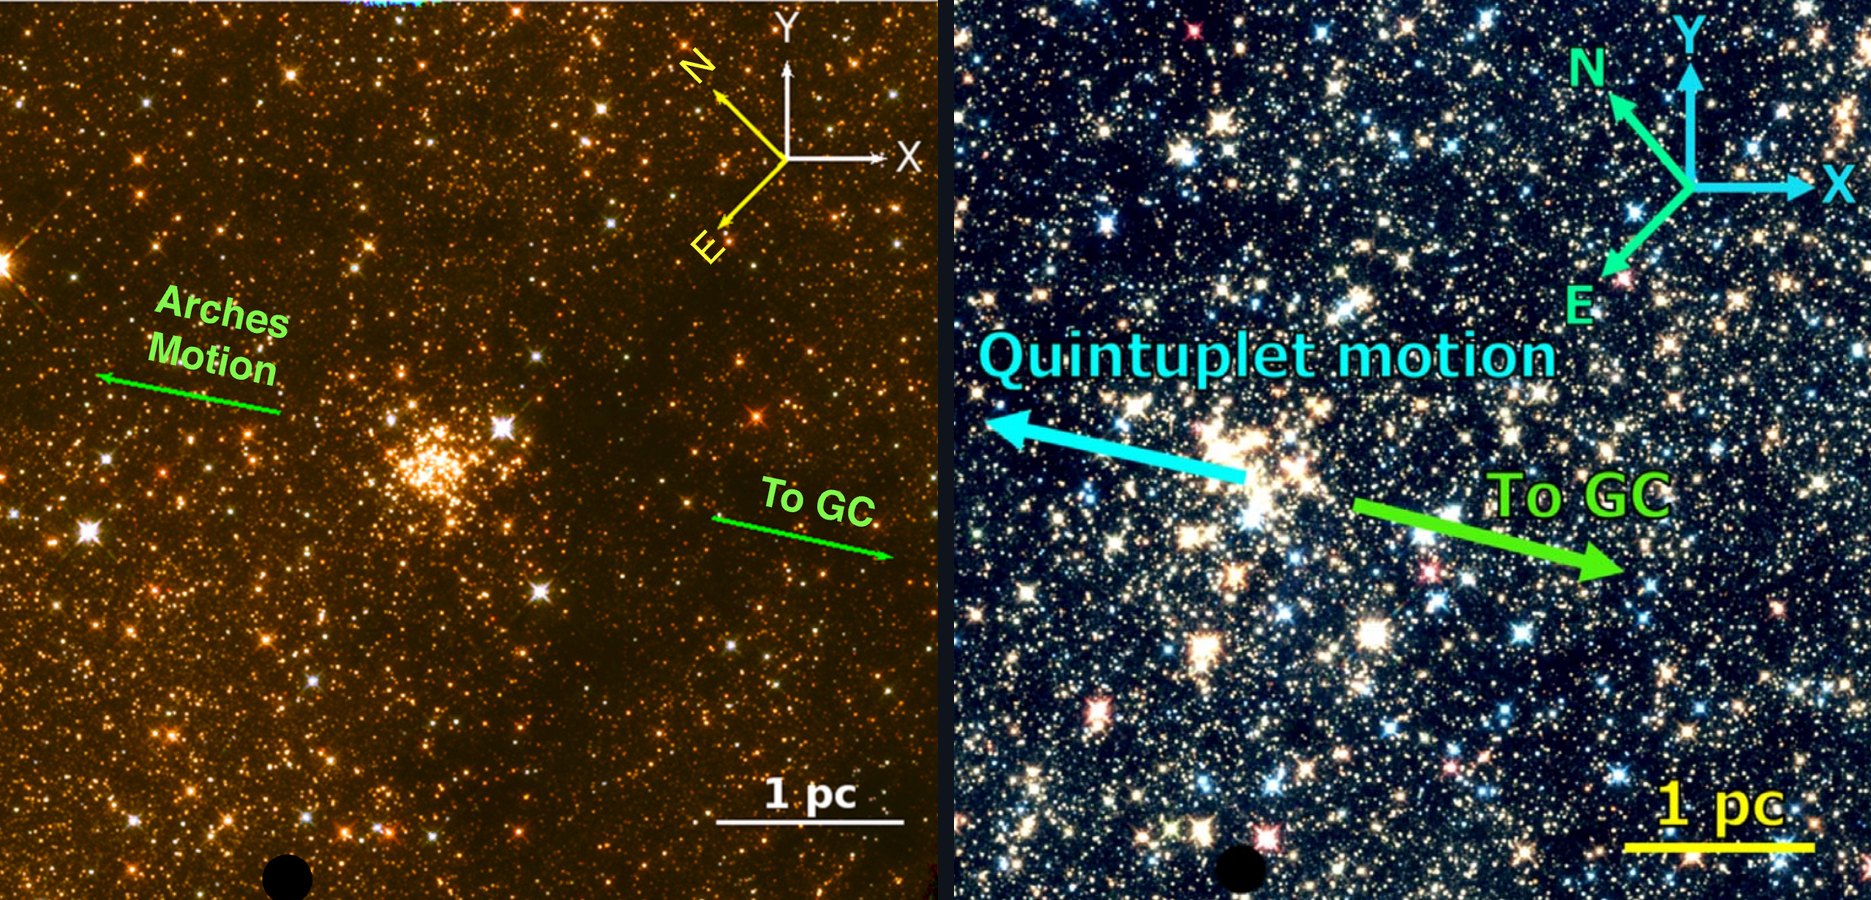
Two Hubble near-infrared images side by side, the Arches cluster on the left and the Quintuplet cluster on the right, each with an arrow showing the cluster's measured motion and the direction to the Galactic center.
The Arches (left) and Quintuplet (right) clusters with Hubble WFC3-IR, with arrows showing each cluster's measured motion across the sky and the direction to the Galactic center. Adapted from Hosek et al. (2015) and Rui et al. (2019).
Q3

How do stars form in the most extreme environment in the Galaxy, and can massive stars form alone?

Compared with the Sun's neighborhood, gas at the Galactic center is roughly twenty times denser, several times hotter, threaded by magnetic fields up to a hundred times stronger, and stirred by turbulence a thousand times more intense. These are conditions closer to those in galaxies ten billion years ago, when most of the universe's stars were made. Whether stars form differently under exterme conditions is one of the central open questions in star formation.

The Galactic center already hints that they do. The Arches cluster contains a larger share of massive stars than clusters near the Sun. And about 80 young, massive stars have been found scattered across the region, apparently belonging to no cluster at all — strange, because nearly all stars are thought to be born in groups.

Roman will settle where these loners came from. If they were born in clusters that have since dissolved, Roman should find faint companions still traveling alongside them. If no such companions exist, massive stars really can form in isolation, and theories of star formation will need to explain how.

For researchers: the IMF and isolated massive stars

Relative to the solar neighborhood, the central molecular zone has ~100× the stellar surface density, ~20× the gas surface density, gas temperatures of 50–100 K, fields of 10–1000 µG and turbulent pressures P/k ~ 109 K cm−3 (Henshaw et al. 2023; Rathborne et al. 2014). Competing models predict different environmental dependence of the IMF's high-mass slope and characteristic mass (e.g., Bonnell et al. 2006; Larson 2005; Chabrier & Dumond 2024). The Arches IMF is top-heavy above 2 M⊙ (Hosek et al. 2019); the program's tidal-tail measurements (Q2) are what allow this to be extended to lower masses.

Roughly 80 young massive stars in the Galactic center are not associated with a known cluster (Mauerhan et al. 2010; Dong et al. 2011; Clark et al. 2021). If most stars form in clusters (Lada & Lada 2003), these should be members of tidally dissolved clusters and sit inside co-moving groups; Martínez-Arranz et al. (2024) found candidate groups for 4 of 59 using HST proper motions (Libralato et al. 2021). Alternatively, isolated formation would point to a mode specific to massive stars or to this environment (Krumholz et al. 2010; Zinnecker & Yorke 2007).

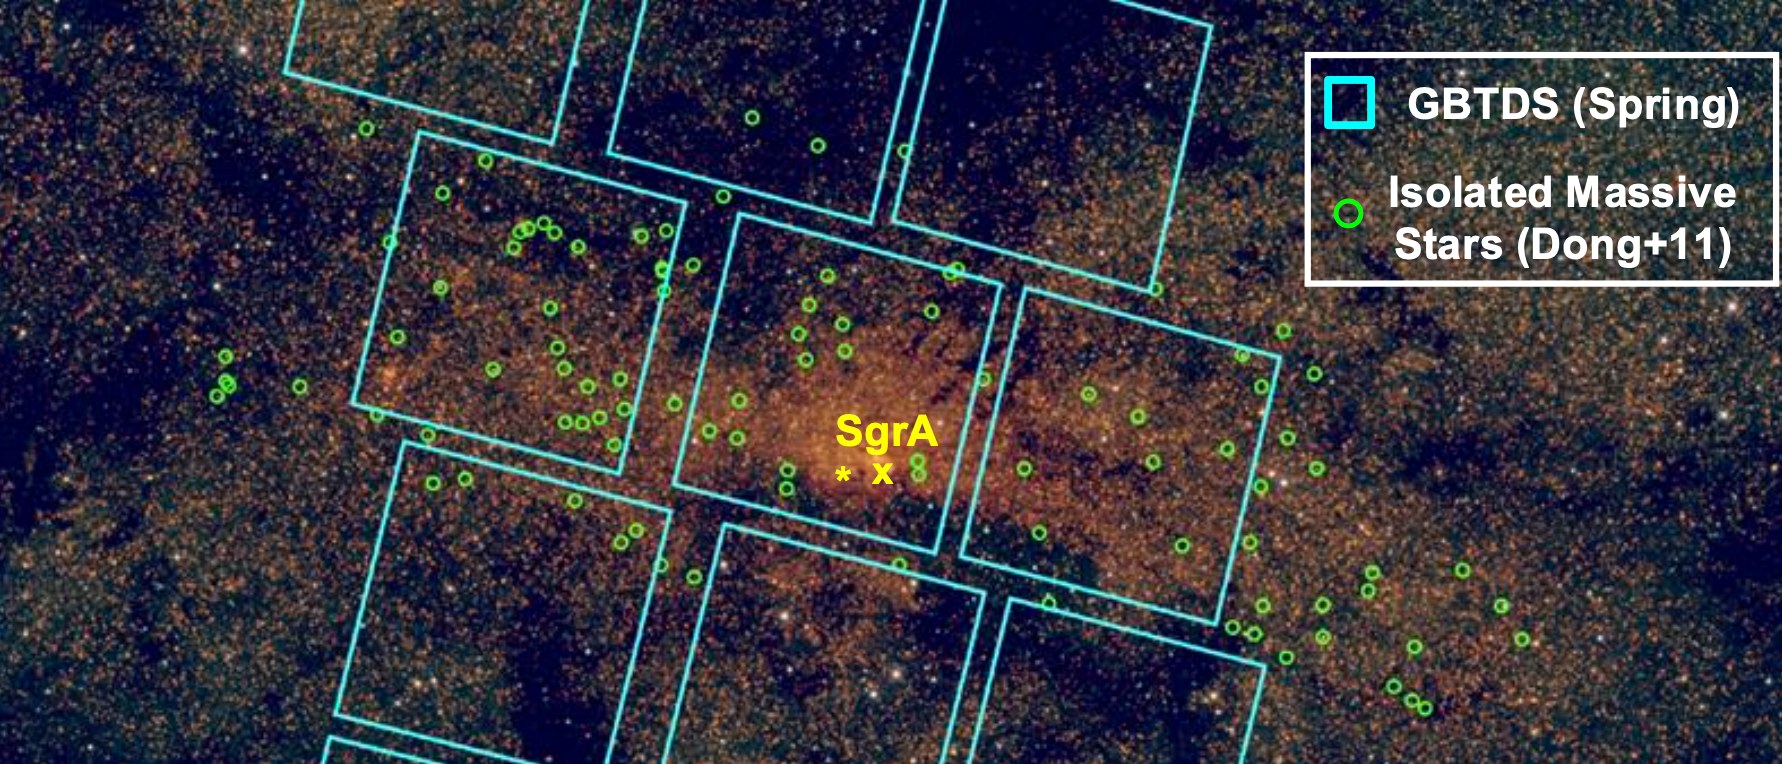
About 50 of the known isolated massive stars fall within the GBTDS Galactic center field. Roman's astrometry reaches ~6.5 mag deeper than the existing HST analysis, enough to detect or exclude co-moving groups of low-mass stars around each one, and to test whether their trajectories trace back to the Young Nuclear, Arches or Quintuplet clusters.

Infrared image of the Galactic center with the Roman GBTDS field outlined in cyan and about eighty green circles marking known isolated young massive stars; roughly fifty fall inside the field.
Known isolated young massive stars (green circles; Dong et al. 2011) over the Roman GBTDS Galactic center pointing (cyan). About 50 of the ~80 known stars fall within the field.
Q4

How does our supermassive black hole feed?

Sgr A* in the near infrared flickers faintly. This light comes from material falling into the supermassive black hole before it gets pass the event horizion. Its infrared brightness varies on every timescale we have been able to probe, from minutes to years, as gas swirls into it. Each flare is a small window onto how matter falls onto a black hole. Until now the longest unbroken infrared watch on Sgr A* lasted about a day.

Roman will look at Sgr A* every 12 minutes for 70 days at a time, over multiple seasons. That is an uninterrupted record much longer than anything before, long enough to see whether the flickering has hidden patterns, how often the largest flares occur, and whether the black hole's activity changes from one year to the next.

For researchers: continuous variability monitoring

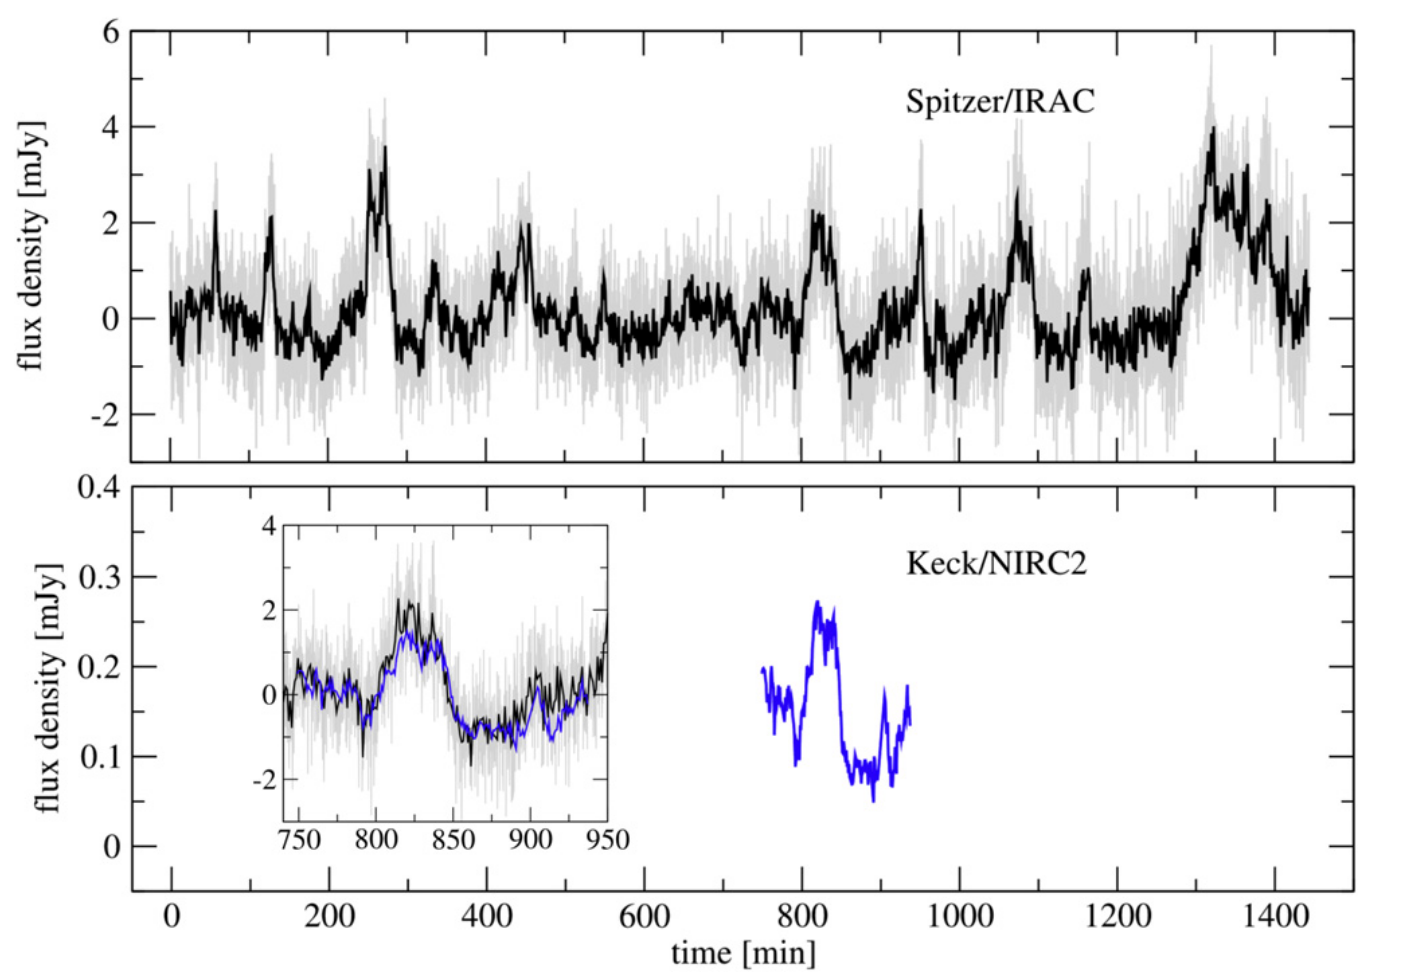
Sgr A* is variable in the near-infrared on all timescales sampled, from minutes to years, and its variability is well described by a red-noise process with a characteristic break timescale of a few hours (Witzel et al. 2018; see Genzel et al. 2010 for a review). The longest continuous near-infrared light curve to date is ~24 hr with Spitzer. Ground-based monitoring is limited by nightly and seasonal gaps, and by weather.

The GBTDS Galactic center field will observe Sgr A* at 12.1-min cadence throughout each ~70-day high-cadence season, yielding uninterrupted light curves that extend the power spectrum by two orders of magnitude in frequency, test for long-timescale trends or periodicities, and characterize the flare rate and duty cycle across seasons. Roman's angular resolution (~0.1″) is coarser than adaptive-optics imaging, so Sgr A* photometry will require careful treatment of the confusing stellar background, an approach the team has developed with HST WFC3-IR.

Two light curves of Sgr A* over 24 hours, from Spitzer/IRAC (top) and Keck/NIRC2 (bottom), showing flux varying by factors of several on timescales of tens of minutes.
Twenty-four hours of Sgr A* in the infrared with Spitzer (top) and Keck (bottom), the longest continuous infrared record to date. Roman will extend this to 70 days without a gap. From Witzel et al. (2018).
& more

What else is hiding in seven million light curves and orbits?

A survey this rich will not be confined to the questions it was designed for. The same data will reveal pulsating stars that serve as distance markers and age tracers (Miras, Cepheids and RR Lyrae stars), eclipsing and interacting binaries, stars being flung out of the Galactic center at extraordinary speeds, and possibly isolated stellar-mass black holes by carefully observing the way they bend the light of stars behind them.

For researchers: ancillary science

The combination of dense time sampling, multi-band snapshots and precise astrometry over the nucleus enables: variable-star censuses (Miras, Cepheids, RR Lyrae) as tracers of the age and distance structure of the NSC and NSD; eclipsing binaries and their period distribution in the nucleus; searches for hypervelocity stars ejected by the Hills mechanism; astrometric and photometric microlensing by compact objects, including candidate isolated black holes; and a public proper-motion catalog that will serve as an astrometric reference frame for JWST, ELT and future high-resolution observations of the region.

Potential discoveries

What Roman could show us for the first time

Some of these would confirm long-standing expectations; others would overturn them. Either outcome teaches us how galactic nuclei work.

The first complete map of how stars move around Sgr A* thoughout the Galactic center region

A single dynamical picture of the black hole, nuclear star cluster and nuclear stellar disk together, and the first measurement of how much mass lies in the inner 25–50 parsecs.

Fossil streams from swallowed star clusters

Groups of stars still moving together billions of years after their parent cluster fell into the nucleus — direct evidence of how the nuclear star cluster grew.

Tidal tails of the Arches and Quintuplet clusters

The first detection of a star cluster being torn apart by a galactic center, and a count of how many stars have already escaped.

A revised recipe for stars in extreme environments

An initial mass function for the young clusters that accounts for the stars they have lost, testing whether star formation really does favor massive stars near the Galactic center.

The birthplaces of the lone massive stars

Either faint co-moving companions that reveal dissolved natal clusters, or a firm demonstration that massive stars can form in isolation.

Seventy days in the life of a black hole

Uninterrupted infrared light curves of Sgr A* many times longer than any before, revealing rhythms in its accretion that shorter observations could not.

Science highlights

News and results from the program

Status

Roman is on its way

The Nancy Grace Roman Space Telescope launched on August 30, 2026 aboard a SpaceX Falcon Heavy from Kennedy Space Center and is traveling to the Sun–Earth L2 point, about 1.5 million kilometers from Earth, where it will spend several months in commissioning. Its Wide Field Instrument was switched on and cooled to operating temperature in mid-September 2026, and instrument calibration is under way. NASA expects first images in early 2027, with the core surveys beginning after that. The Galactic Bulge Time Domain Survey will run in spring and autumn seasons over the five-year prime mission.

Roman has no proprietary period: every image is public as soon as it is processed. Our program will build on the survey's astrometric pipeline products and release its proper-motion catalogs and models so that others can use them.

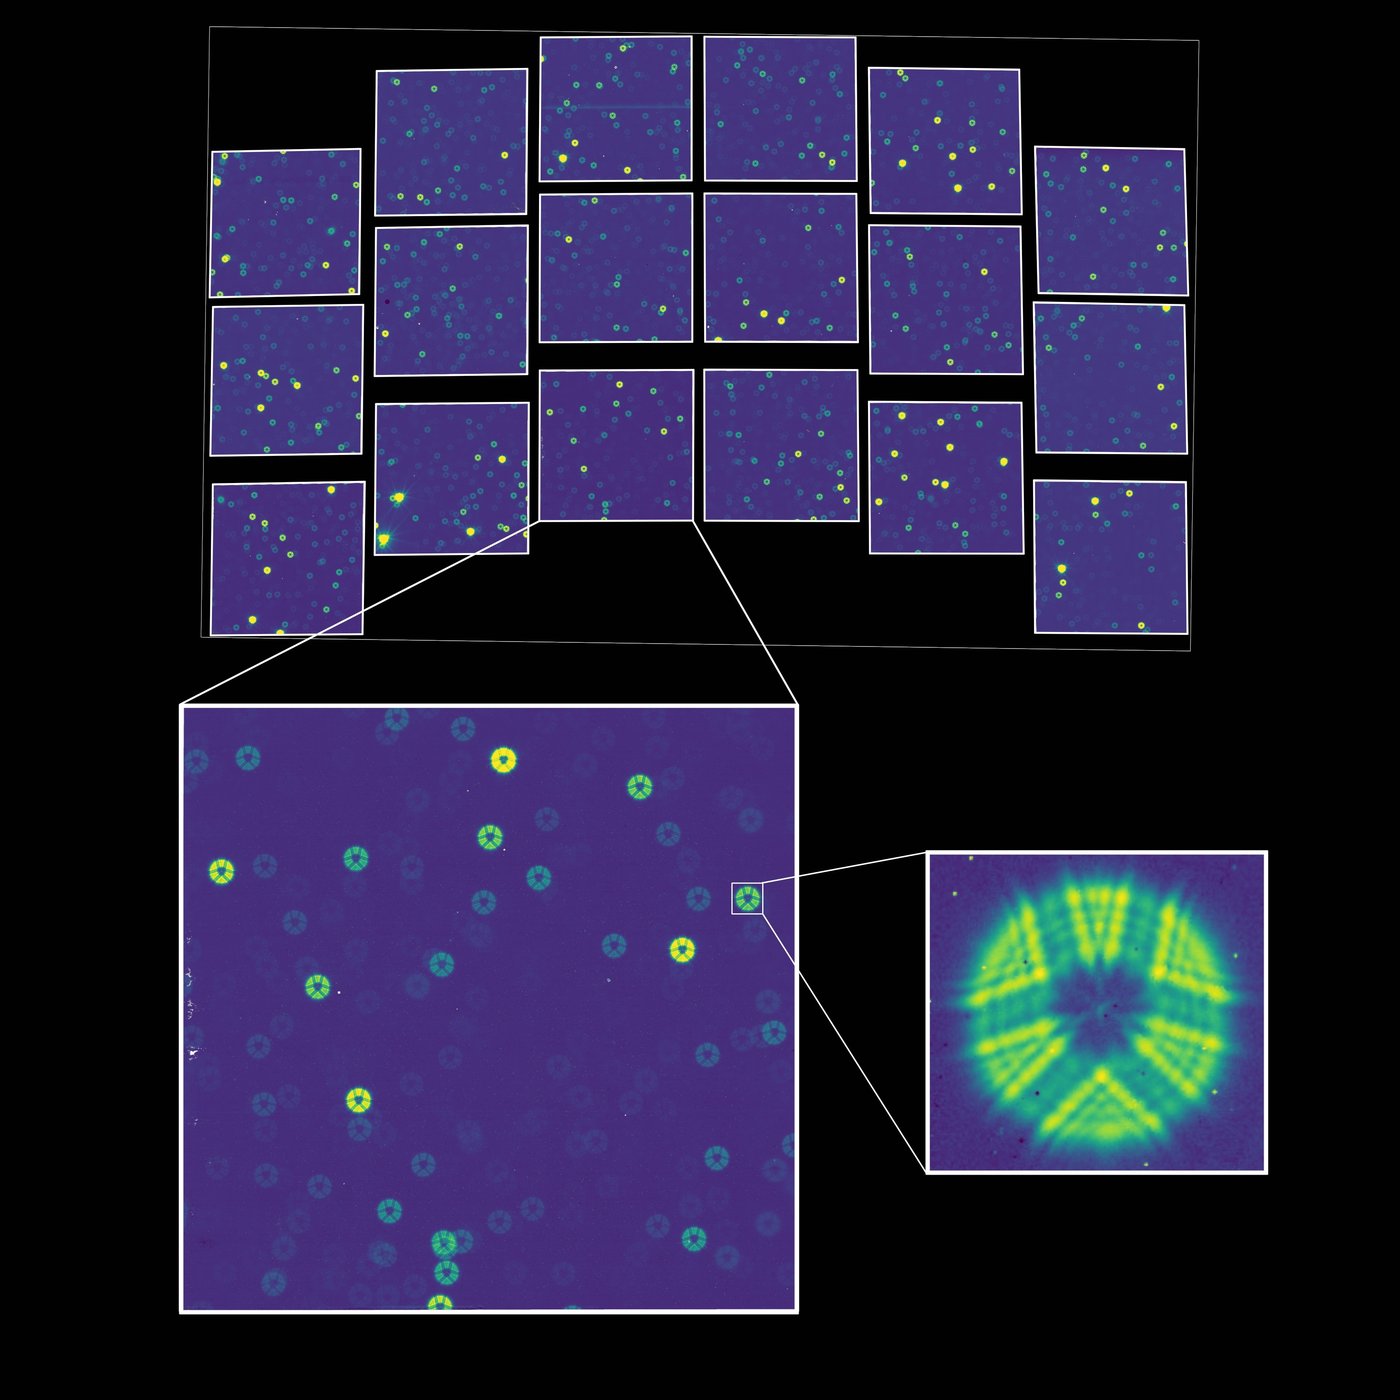
Roman's first test image, a grid of the Wide Field Instrument's eighteen detectors dotted with out-of-focus stars, with insets zooming to one detector and then to a single donut-shaped star image.
First light. The very first starlight recorded by Roman's Wide Field Instrument, taken in September 2026 with the detector array still in its launch position and far from focus, so each star appears as a broad ring spread over thousands of pixels. The insets zoom to one of the 18 detectors and then to a single star. Once the optics are aligned, each of these rings will shrink to a sharp point. NASA's Goddard Space Flight Center / Tyler Desjardins (STScI).
Team & program

Who we are

The Roman Galactic Center Science Program is led from the University of California, Los Angeles, and is part of the UCLA Astrophysics Data Lab, which develops the data-science methods needed to turn surveys of this scale into measurements.

The program is partially supported by a Roman Cycle 1 General Investigator large program: Roman Galactic Center Project, program 19078.

Principal Investigator
University of California, Los Angeles
Co-Principal Investigator
Dr. Matt Hosek
University of California, Los Angeles

Students and researchers interested in joining the program should see the Joining our Lab section of the Data Lab site or contact the PI at tdo@astro.ucla.edu.

Further reading

Learn more